Senior Data Analyst
turning messy data into decisions.

My work spans the full data stack, from building pipelines and financial models to the analysis that product, growth and revenue teams act on.

  • 4.5+ years
  • Product Analytics
  • Financial Modelling
  • Analytics Engineering
  1. Question

    Understand the problem before touching the data.

  2. Data

    Pull, clean and sanity‑check the data.

  3. Insight

    Find patterns and explain why they happen.

  4. Decision

    Share what to do next, then check it worked.

About

I studied Software Engineering at NED University of Engineering & Technology and graduated third in my batch with a 3.88 CGPA. At university, the projects I liked most were the ones with data in them, so moving into analytics after graduating felt natural. I’m most at home working between the business and the tech.

AI has changed my day-to-day more than any tool before it. I use it to write code, explore data and get through routine tasks, so I can take on a much wider range of projects and keep my own time for the parts that need real thought. Usually those start with messy data and a question nobody has answered yet, which is exactly what I enjoy.

I value people who care about the details and are willing to change their mind when the data says to.

Illustrated portrait of Hanifa Elahi

Experience

  1. Lead Data Analyst Maqsad

    October 2025 – Present
    • Built the financial model for the company’s acquisition by Pakistan’s largest telecom operator, covering 8 product lines and projecting 4.7× lead growth and 10× revenue growth by FY29.
    • Developed the operating model linking marketing spend, leads, sales, revenue and contribution margin across 5 product lines; informed decisions that lifted test-prep margin from 11% to 70% and cut lead costs by ~40%.
    • Built a rule-based lead classifier with Claude Code that sorted 28K+ chat leads by intent, contributing to a rise in conversion from 1% to 4% over four months.
    • Analysed 26.7K leads and found a segment converting nearly 4× more often; worked with marketing to restructure campaigns and shift spend toward it.
    • Designed a lead-scoring model from the mobile and web behaviour of 10K users that filters out 60–70% of low-intent leads and builds a warm lead pool for peak season.
    • Set up and owned app install attribution with the mobile and backend teams, contributing to a 6% lift in conversion.
  2. Senior Data Analyst Maqsad

    March 2024 – September 2025
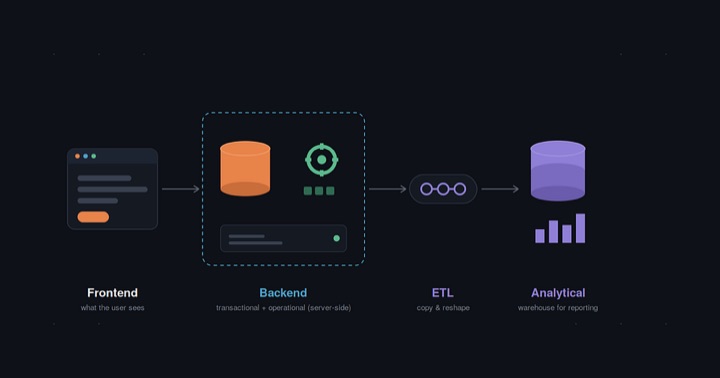
    • Rebuilt Spark ETL pipelines with incremental Iceberg MERGE loads, cutting query time by 25% and daily pipeline costs by 40%.
    • Built a real-time Kafka and Mage AI pipeline that surfaces high-intent student actions to sales within seconds, cutting lead response time by 80%.
    • Implemented Medallion architecture in dbt (Bronze, Silver, Gold), giving teams clean data to query directly and cutting ad-hoc data requests by 30%.
    • Managed two junior analysts: reviewed their SQL and analysis, prioritised team requests, and trained them on dbt and the pipeline stack.
    • Primary analytics partner for product, growth and marketing: ran in-app experiments and turned business questions into analysis, reports and dashboards.
  3. Data Analyst Maqsad

    February 2023 – February 2024
    • Led North Star Metric analysis on weekly activity: consistently active users were 5× more likely to convert; focusing on early engagement helped double 7-day retention.
    • Audited coin balances across 4M+ users and flagged 15K accounts with excess rewards from leaky rules; the fix contributed to a 3× rise in net revenue.
    • Mapped the install-to-purchase funnel for test-prep users to find the features that drive purchases, contributing to a 5% increase in conversion.
    • Traced 24.1% of 329K+ unviewed videos to poor search matching and worked with engineering to bring it down to 16%.
  4. Financial Data Analyst iSystematic, Inc.

    January 2022 – January 2023
    • Built an Excel-based trading algorithm using predictive models and sentiment indicators, improving signal precision by 15%.
    • Ran fundamental, technical and backtesting analysis of US and ASX 200 equities across 1990–2021 market downturns.

Skills & stack

Product & Growth Analytics

  • Retention & cohort analysis
  • Funnel analysis
  • A/B testing
  • North Star metrics
  • Segmentation & lead scoring
  • Attribution

Financial Modelling

  • Financial models
  • Operating models
  • KPI design
  • Board & investor reporting

Analytics Engineering

  • Data modelling
  • ETL pipeline design
  • Medallion architecture
  • SQL optimisation

AI in Analytics

  • LLMs in data pipelines
  • Text classification with LLMs
  • Prompt engineering
  • AI-assisted coding

Stack

Languages & databases
PythonSQLBigQueryTrinoPostgreSQLMySQL
Data engineering
dbtSparkIcebergKafkaMage AI
BI & product analytics
SupersetPower BIExcel / SheetsLooker StudioMixpanelGoogle AnalyticsGoogle AdsMeta Ads
AI & workflow
Claude CodeOpenAI APIAzure OpenAIGitJupyter

In their words

More on LinkedIn ↗
Hanifa is an incredibly passionate data leader who sets the gold standard for what it means to be a data analyst – extremely skilled at her craft, knowledgeable, with immaculate attention to detail and very organised in her workflows… A dependable and great mentor to the rest of the team…
Afreen DarSenior Product ManagerManaged Hanifa directly
Hanifa is a super talented individual whose attention to detail, curiosity and dedication have been qualities I have always deeply appreciated… She uses AI incredibly effectively to amplify her impact, bringing the kind of output you would expect from an entire data team!
Dania Zulfiqar SiddiquiProduct ManagerWorked on the same team
Hanifa is an exceptionally astute and diligent professional… she consistently demonstrated a remarkable capacity to rapidly synthesize complex concepts and translate them into actionable insights.
Nabeel KhanFounder, iSystematicManaged Hanifa directly
LET'S CONNECT

Hiring for analytics, or stuck on a messy data problem?

I’m based in Karachi, Pakistan (UTC+5). Feel free to reach out about data roles, collaborations or an analytics problem you’re working on.

Cloud Cost Forecasting

How cloud costs change as a business scales, and why the bill rose in steps rather than with demand.

ForecastingCost modellingDriver analysisUnit economics

Summary

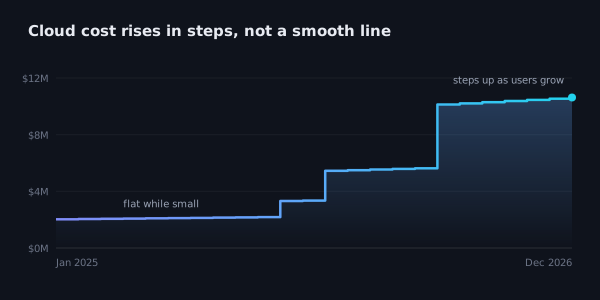
I wanted to forecast how cloud costs would change as the user base grew. The obvious approach was to tie the bill to demand, but the history didn’t support that. Most of the bill was fixed, and it went up in steps whenever more capacity was needed.

So I built the forecast around those steps. It works out which infrastructure size each level of usage needs, prices it, and adds a small usage-based cost on top.

Flow: active users, users at the busiest point, which size step that lands in, cost of that step plus a small usage cost, cost per user
How the cost is worked out

What I checked first

I put the monthly cloud bill next to leads, enrolments and revenue. Leads moved a lot from month to month, about six times between the quietest and busiest months, while the bill stayed almost flat.

A model like cost per lead or cost as a share of revenue assumes the bill grows with demand. The data showed it didn’t, so I dropped that approach.

Bar and line chart: monthly leads vary widely while the cloud bill stays flat
Leads against the monthly cloud bill

What the bill was made of

I split the bill into two parts:

  • Fixed cost: servers, databases, storage and other infrastructure that runs no matter how many people use the platform.
  • Variable cost: things that move with usage, such as data transfer.

Most of it was fixed, which explained why the bill hardly reacted to demand. The forecast starts from the fixed cost and treats the variable part separately.

The model

My first try was a fixed base plus a cost per user. That gives a straight line, with a little more cost for every new user. The history looked different: the bill stayed flat, then jumped when the setup ran out of room.

So I modelled the infrastructure rather than the cost. For each month, the model checks:

  • how many users are active
  • how many are on at the busiest point
  • which infrastructure size that needs
  • what that size costs, plus the small usage-based part

The cost only changes when usage passes a size’s limit, so going from 10,000 to 20,000 users doesn’t double the bill. The forecast shows when the bigger increases are likely to happen.

Chart: the monthly cloud bill stays flat, then rises in steps as the user base grows
Cost moves in steps as capacity is added

Cost per user

Dividing the total cost by the number of users shows there isn’t one fixed cost per user. For example, with a fixed cost of $20,000 a month:

UsersCost per user
20,000$1.00
200,000$0.10
2,000,000$0.01

The bill is the same in every row. It’s just shared across more users, which is why a single cost-per-user figure would be misleading.

Line chart: cost per user falls sharply as the user base grows
Cost per user as the user base grows

Data vs assumptions

From historical data

  • the starting fixed cost
  • the split between fixed and variable cost

Assumptions

  • how big each future infrastructure step will be
  • what share of users are active at the busiest point

Both assumptions are inputs, so they can be changed without rebuilding the model.

This is based on a forecasting model I built at work. The numbers are synthetic because the real figures are confidential; the method and the cost behaviour are from the actual analysis.

Full write-up on GitHub ↗

Lead Classification from Sales Chats

Sorting hundreds of sales chats a day by buying intent, so agents call the students most likely to buy first.

Rule-based classificationLead qualificationFunnel analysisText analyticsChat data

Summary

Leads from every ad and channel landed in one chat inbox, and agents had no quick way to tell who was serious. I built a rule-based classifier that tags every chat by buying intent and refreshes the call list several times a day, so the students most likely to buy are reached first.

  • 28K+ chats tagged over five months
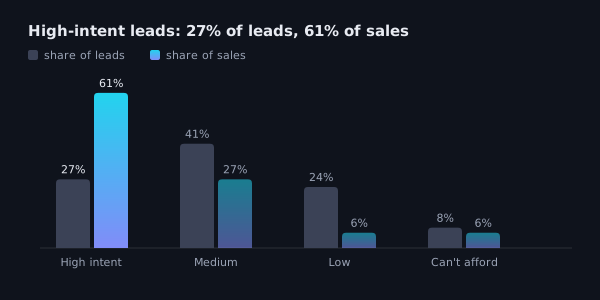
  • High-intent leads were 27% of qualified leads and brought 61% of their sales
  • Fewer than 0.1% of chats tagged irrelevant ever led to a sale
  • Conversion on the main course rose from 1% to 4% in four months

Built with Python, Claude Code, the Chatwoot API and Google Sheets.

The problem

Many leads came from ads that open a chat with a message already typed out. The student sends it, a bot asks a few questions, and then a sales agent takes over.

Some students never wrote again. Some were years away from the exam, wanted a course the business didn’t offer, or were looking for a job. A few were asking about fees, start dates and how to pay, and those were the ones agents needed to reach.

Before this, anyone who replied counted as qualified, so “ok” counted the same as “how do I pay?”. Agents opened chats one by one, and students who were ready to buy waited behind chats that were never going to sell.

Why it was hard

  • Nothing to check against. Nobody had tagged these chats before, so in the first week I tagged close to 100 a day by hand to learn what “right” looked like.
  • Messy text. Students mixed languages and spelled words however they liked, and even agents wrote “irrelevant” several ways. Lead-scoring tools rely on forms and website tracking, and all we had was the chat.
  • Live use. Agents worked from the output during the day, so a bad rule could reach the call list within hours. Every fix also had to be re-run on past days without quietly changing last week’s numbers.

What each chat gets

Every chat gets a tag, a sub-label, a confidence level and a one-line reason.

TagMeans
QualifiedA real student in a real conversation, ranked high, medium or low intent, or can’t afford
No responseSent the pre-typed message and nothing else
IrrelevantNot a lead for this course
Future leadA real student, but for a later exam year

Sales used the tag to decide who to call, and marketing used the sub-label to see why leads were lost. Payment is a separate flag, so a chat can be high intent and paid at the same time.

Flow: chat, prepare and clean, rule ladder, set aside or rank by what they asked, tag with confidence and reason, manual corrections, one row per student, final lead list
How a chat moves through the pipeline

Why rules, not AI

I drafted an AI version with the same labels first, then went with rules because of how often it had to run and how quickly mistakes needed fixing.

  • Free to run, so tagging several times a day added no API bill
  • Re-running every past day after a fix took seconds
  • The same chat always got the same tag, which daily reports depend on
  • A wrong tag pointed straight to the rule behind it

The cost is upkeep. Students keep finding new ways to say the same thing, so the rules keep growing, and rules can’t read voice notes or catch sarcasm.

How it works

  1. Prepare the chat. Pull the full thread, mark who sent each message and remove the pre-typed opening. Each day’s tag uses only that day’s messages.
  2. Apply the rules in order. Chats that aren’t leads are set aside first. The agent’s call comes first, and “not interested” only counts near the end of a chat.
  3. Rank by buying intent. What a student asks matters more than how much they write, so “too expensive” followed by “how do I pay?” is high intent.
  4. Correct and de-duplicate. Hand corrections override the rules, and each student keeps only their best tag per course.

During the day it tagged new chats several times and pushed high-intent leads to the sheet agents already used. Once a day it re-tagged everything as the final record.

To improve the rules, I compared them with hand-tagged chats, logged each mismatch with the chat that caused it, fixed the rule and re-ran past days to see what else changed. I confirmed every proposed fix by hand before it went in.

Loop: tag chats by hand, compare with the rules, find a disagreement, fix the rule and log it, re-run past days
How the rules were checked and fixed

Results

Agents started each round with the students most likely to buy, instead of working through the inbox in the order chats arrived. Because the list refreshed during the day, those students were reached the same day they messaged.

  • High-intent leads were 27% of qualified leads and brought 61% of their sales, converting 3 to nearly 9× better than the other tiers. Part of that comes from being called first, which was the point.
  • Fewer than 0.1% of chats set aside as irrelevant ever led to a sale, so agents could skip them safely.
  • “Can’t afford” leads stayed on the list and converted better than medium and low intent.
  • Conversion on the main course went from 1% to 4% in four months. Lead volume fell over the same period as the season ended, so not all of that is the tagging.
Bar chart: share of qualified leads vs share of sales by tier. High intent 27% vs 61%, medium 41% vs 27%, low 24% vs 6%, can't afford 8% vs 6%
Share of qualified leads vs share of sales, by tier

What I’d check next

  • Accuracy. The rules were checked against hand-tagged chats but never on a separate test set. Next is a labelled test set with precision and recall for each tag, compared side by side with an AI classifier.
  • Future leads. On the main course they converted at 8.1%, higher than qualified leads. Either next-year students signed up on schedule, or the “next year” rules were catching students who were ready now.

Company details and example phrases are generalised. The labels, rules, workflow and results are from production.

Full write-up on GitHub ↗

Predicting Buyers from App Behaviour

What new users do across the mobile and web app, what buyers do differently, and how that became a way to spot likely buyers early.

Behavioural analyticsBuyer segmentationLead scoringMatched comparisonEvent data

Summary

New users arrive every day, installing the mobile app or signing up on the web, and most of them never pay. The question was whether app activity alone could show which new users are likely to pay, and which actions show it most reliably.

I compared users who paid with similar users who didn’t, found four distinct ways people buy, and kept only the behaviours that genuinely set buyers apart. Those became five tiers with a clear action each, applied to new users every week.

  • Three behaviours made a user roughly twice as likely to pay
  • Several actions that sound like intent turned out to be just as common among non-buyers
  • More than half of new users each week could be left out of calls

Built with SQL, Python, Claude Code and Google Sheets.

Flow: new user, clean up events, build a profile, find buyer types, compare with non-buyers, find the signals, tier, score and reason, weekly call list
How a new user moves through the scoring

How I approached it

Looking only at users who paid would show what buyers do, but not whether it sets them apart. So I worked with two groups:

  • users who paid, with their full journey from joining to payment
  • users who didn’t pay, who joined over the same months, chose the same exam and had at least a month to buy

If both groups do something, it can’t tell you who will pay. There was also no data on how users found the app, so everything had to come from behaviour.

Making the data readable

The same action was often logged differently on mobile and web. I matched and merged those events into one consistent set, tagged each by platform and separated real actions from navigation noise.

Then I sorted actions into three layers: engagement (using the product), buying steps (checking prices, hitting a paywall, starting checkout, asking for help) and navigation (moving around the app). Each user was then described the same way, with counts scaled so the heaviest users didn’t skew the comparison.

Diagram: mobile and web events merged into one clean set of actions, split into engagement, buying steps and navigation
From messy events to three layers

Four ways users buy

Grouping paying users by how they behaved before buying gave four clear patterns, each taking a very different amount of time to pay.

Buyer typeWhat they do
Came to buyAbout 4 in 10 buyers. Barely use the app and pay within hours, often in the first session.
Wants a conversationAbout a quarter. Try a little, ask for help, then pay within days.
Convinced by the productAbout a quarter. Use the product properly for a few months before deciding.
Power explorerAbout 1 in 10. Use everything heavily for over a year before paying.

These are snapshots, not fixed labels. A user can move between types, and a new user’s type only settles after the first few days.

People also buy in two waves. About half of buyers paid within a week of joining, and about 3 in 10 came back six months or more later as the exam got close, with very little in between. So the first days after joining matter most, and users who go quiet aren’t necessarily lost.

Bubble chart: four buyer types placed by time to pay and how much they use the app, sized by share of buyers
Four ways users buy

Signals that matter

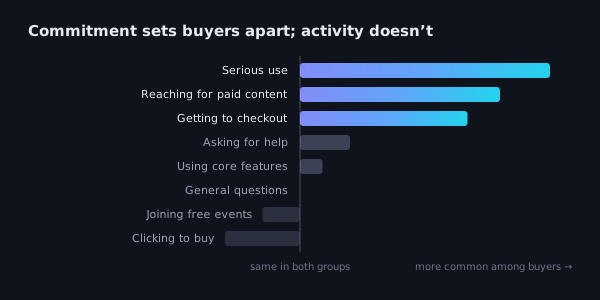
For every behaviour, I compared how often buyers did it with how often non-buyers did. That changed the answer. Asking for help looked strong when I only looked at buyers, but plenty of non-buyers did it too.

Three behaviours held up, each making a user roughly twice as likely to pay:

  • serious use, going deep into the product rather than just trying it
  • reaching for paid content
  • getting to checkout, then stopping before finishing

Clicking to buy, joining free events and general browsing were as common among non-buyers. Even the strong signals aren’t guarantees: most users who show one still don’t pay. Activity shows interest; commitment shows a likely buyer.

Bar chart: serious use, reaching for paid content and getting to checkout are far more common among buyers; clicking to buy and joining free events are more common among non-buyers
Which behaviours set buyers apart

From signals to action

The signals and buyer types became five tiers, each with a clear action.

TierAction
HOTShows a commitment signal or looks like a power explorer. Call within a day or two.
LOW-SIGNALDid almost nothing, like the came-to-buy group. Find out how they came in, then call quickly.
WARMSome interest in paying, no strong signal. Soft follow-up.
COLDLow activity that doesn’t match came-to-buy. Check how they came in first.
COOLBrowsing only. No calls, marketing only.

Within each tier, a priority score sets the order, and every user gets a plain reason line so the person calling knows why. Each week a small share came out HOT and more than half came out COOL. Every HOT user also went into one running list, so the busy season starts with a ready pool of likely buyers.

Funnel: HOT, LOW-SIGNAL, WARM, COLD and COOL tiers, from smallest share called first to largest share not called
Five tiers, each with a clear action

What I’d check next

  • A fairer comparison. Buyers’ activity stops when they pay, while non-buyers had at least a month. Comparing both over the same first days after joining would make the signals more reliable.
  • Where the quick buyers come from. About 4 in 10 buyers can’t be spotted from behaviour because they barely use the app. Data on how users found the app would close that gap.
  • Follow-up outcomes. Recording whether flagged users were reached, and what happened, would show which tiers really convert.
  • A proper test. Splitting new users between this scoring and the usual approach for a few weeks would show how much it actually helps.

Company details, product features and figures are generalised. The approach and findings are from the actual analysis.

Full write-up on GitHub ↗